Standard Deviation Calculator Guide helps you measure how spread out or consistent a set of data values is. Standard deviation is one of the most important statistical concepts used in mathematics, data analysis, finance, science, and research.
This complete Standard Deviation Calculator guide explains what standard deviation means, how it is calculated, why it is important, and how to use an online standard deviation calculator to analyze data quickly and accurately.
What Is Standard Deviation?
Standard deviation is a statistical measure that shows how much individual data values differ from the average (mean) of a dataset. A low standard deviation means the values are close to the mean, while a high standard deviation means the values are more spread out.
It is commonly used to understand data variability and consistency.
Why Standard Deviation Is Important
- Measures data spread and variability
- Helps compare different datasets
- Used in statistics, finance, and research
- Supports decision-making and analysis
- Identifies consistency and risk levels
How a Standard Deviation Calculator Works
A Standard Deviation Calculator works by calculating the mean of a dataset, finding the difference of each value from the mean, squaring those differences, averaging them, and then taking the square root.
This automated process provides accurate results instantly.
Standard Deviation Formula Explained
There are two common types of standard deviation:
- Population Standard Deviation (σ): Used when data represents the entire population
- Sample Standard Deviation (s): Used when data is a sample of a population
Sample Standard Deviation Formula:
- s = √[ Σ(x − x̄)² ÷ (n − 1) ]
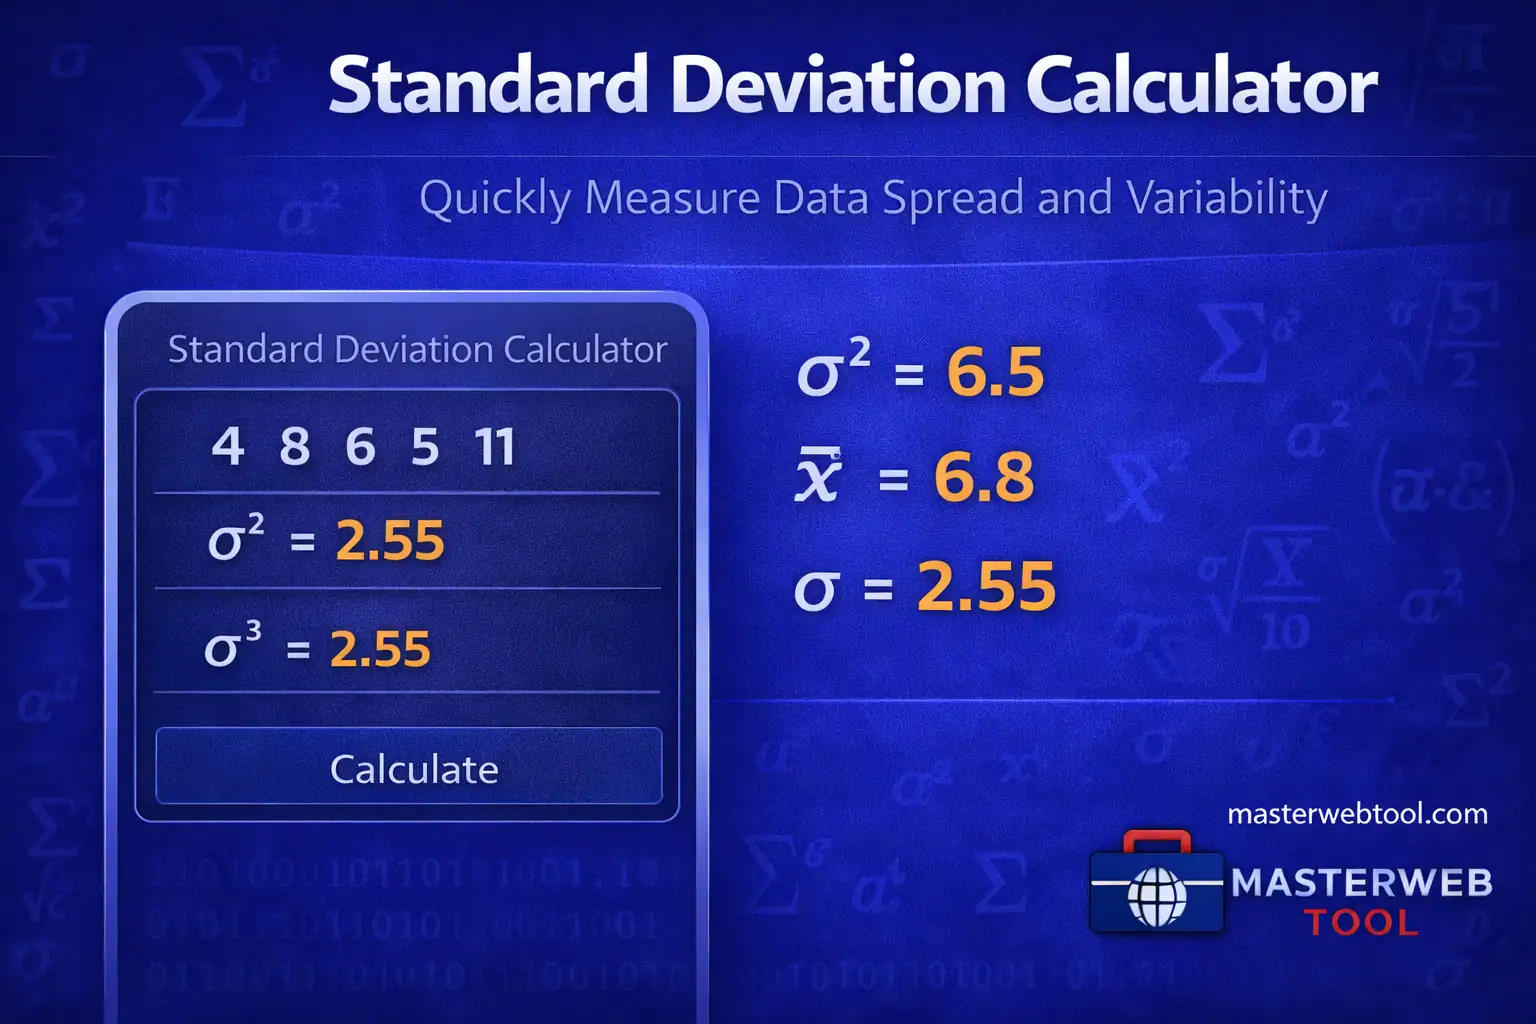
How to Use a Standard Deviation Calculator (Step-by-Step)
- Open the Standard Deviation Calculator tool
- Enter your data values (comma-separated)
- Select population or sample option if available
- Click on the calculate button
- View the mean and standard deviation instantly
Understanding Your Standard Deviation Result
A small standard deviation indicates data values are close to the average, showing consistency. A large standard deviation indicates more variation in the data.
Understanding this helps analyze trends, risks, and patterns effectively.
Standard Deviation vs Variance
- Variance: Average of squared differences from the mean
- Standard Deviation: Square root of variance
Standard deviation is preferred because it is expressed in the same units as the data.
Who Should Use a Standard Deviation Calculator?
- Students and teachers
- Data analysts and researchers
- Finance and investment professionals
- Scientists and statisticians
- Anyone working with numerical data
Common Mistakes When Calculating Standard Deviation
- Using wrong formula (sample vs population)
- Incorrect data entry
- Ignoring outliers
- Manual calculation errors
Tips for Accurate Statistical Analysis
- Verify data before calculation
- Choose correct deviation type
- Use reliable online tools
- Combine with mean and variance
Related Calculator Tools
Calculate Standard Deviation Instantly
Use our free Standard Deviation Calculator to analyze data spread and variability quickly and accurately.
Open Standard Deviation Calculator →Frequently Asked Questions (FAQ)
What is a Standard Deviation Calculator?
A Standard Deviation Calculator is an online tool that calculates the standard deviation of a dataset to measure data variability.
Is an online Standard Deviation Calculator accurate?
Yes, it uses correct statistical formulas and provides accurate results instantly.
What is the difference between sample and population standard deviation?
Sample standard deviation is used for sample data, while population standard deviation is used when the dataset represents the entire population.
Who can benefit from a Standard Deviation Calculator?
Students, researchers, analysts, and professionals working with data can benefit from it.

Ravi Chand Yadav is the founder of MasterWebTool, focused on building fast, simple, and reliable online calculators and data analysis tools for everyday use.